Case studies, school to Samsung.
Five projects: corporate analytics work at Audi and Samsung, and three full-funnel and consulting builds from my MS in Marketing Analytics. Each one ran the same loop. Segment the audience, model the economics, allocate the budget, then tie every dollar to a KPI.
Finding the leak in a luxury funnel.
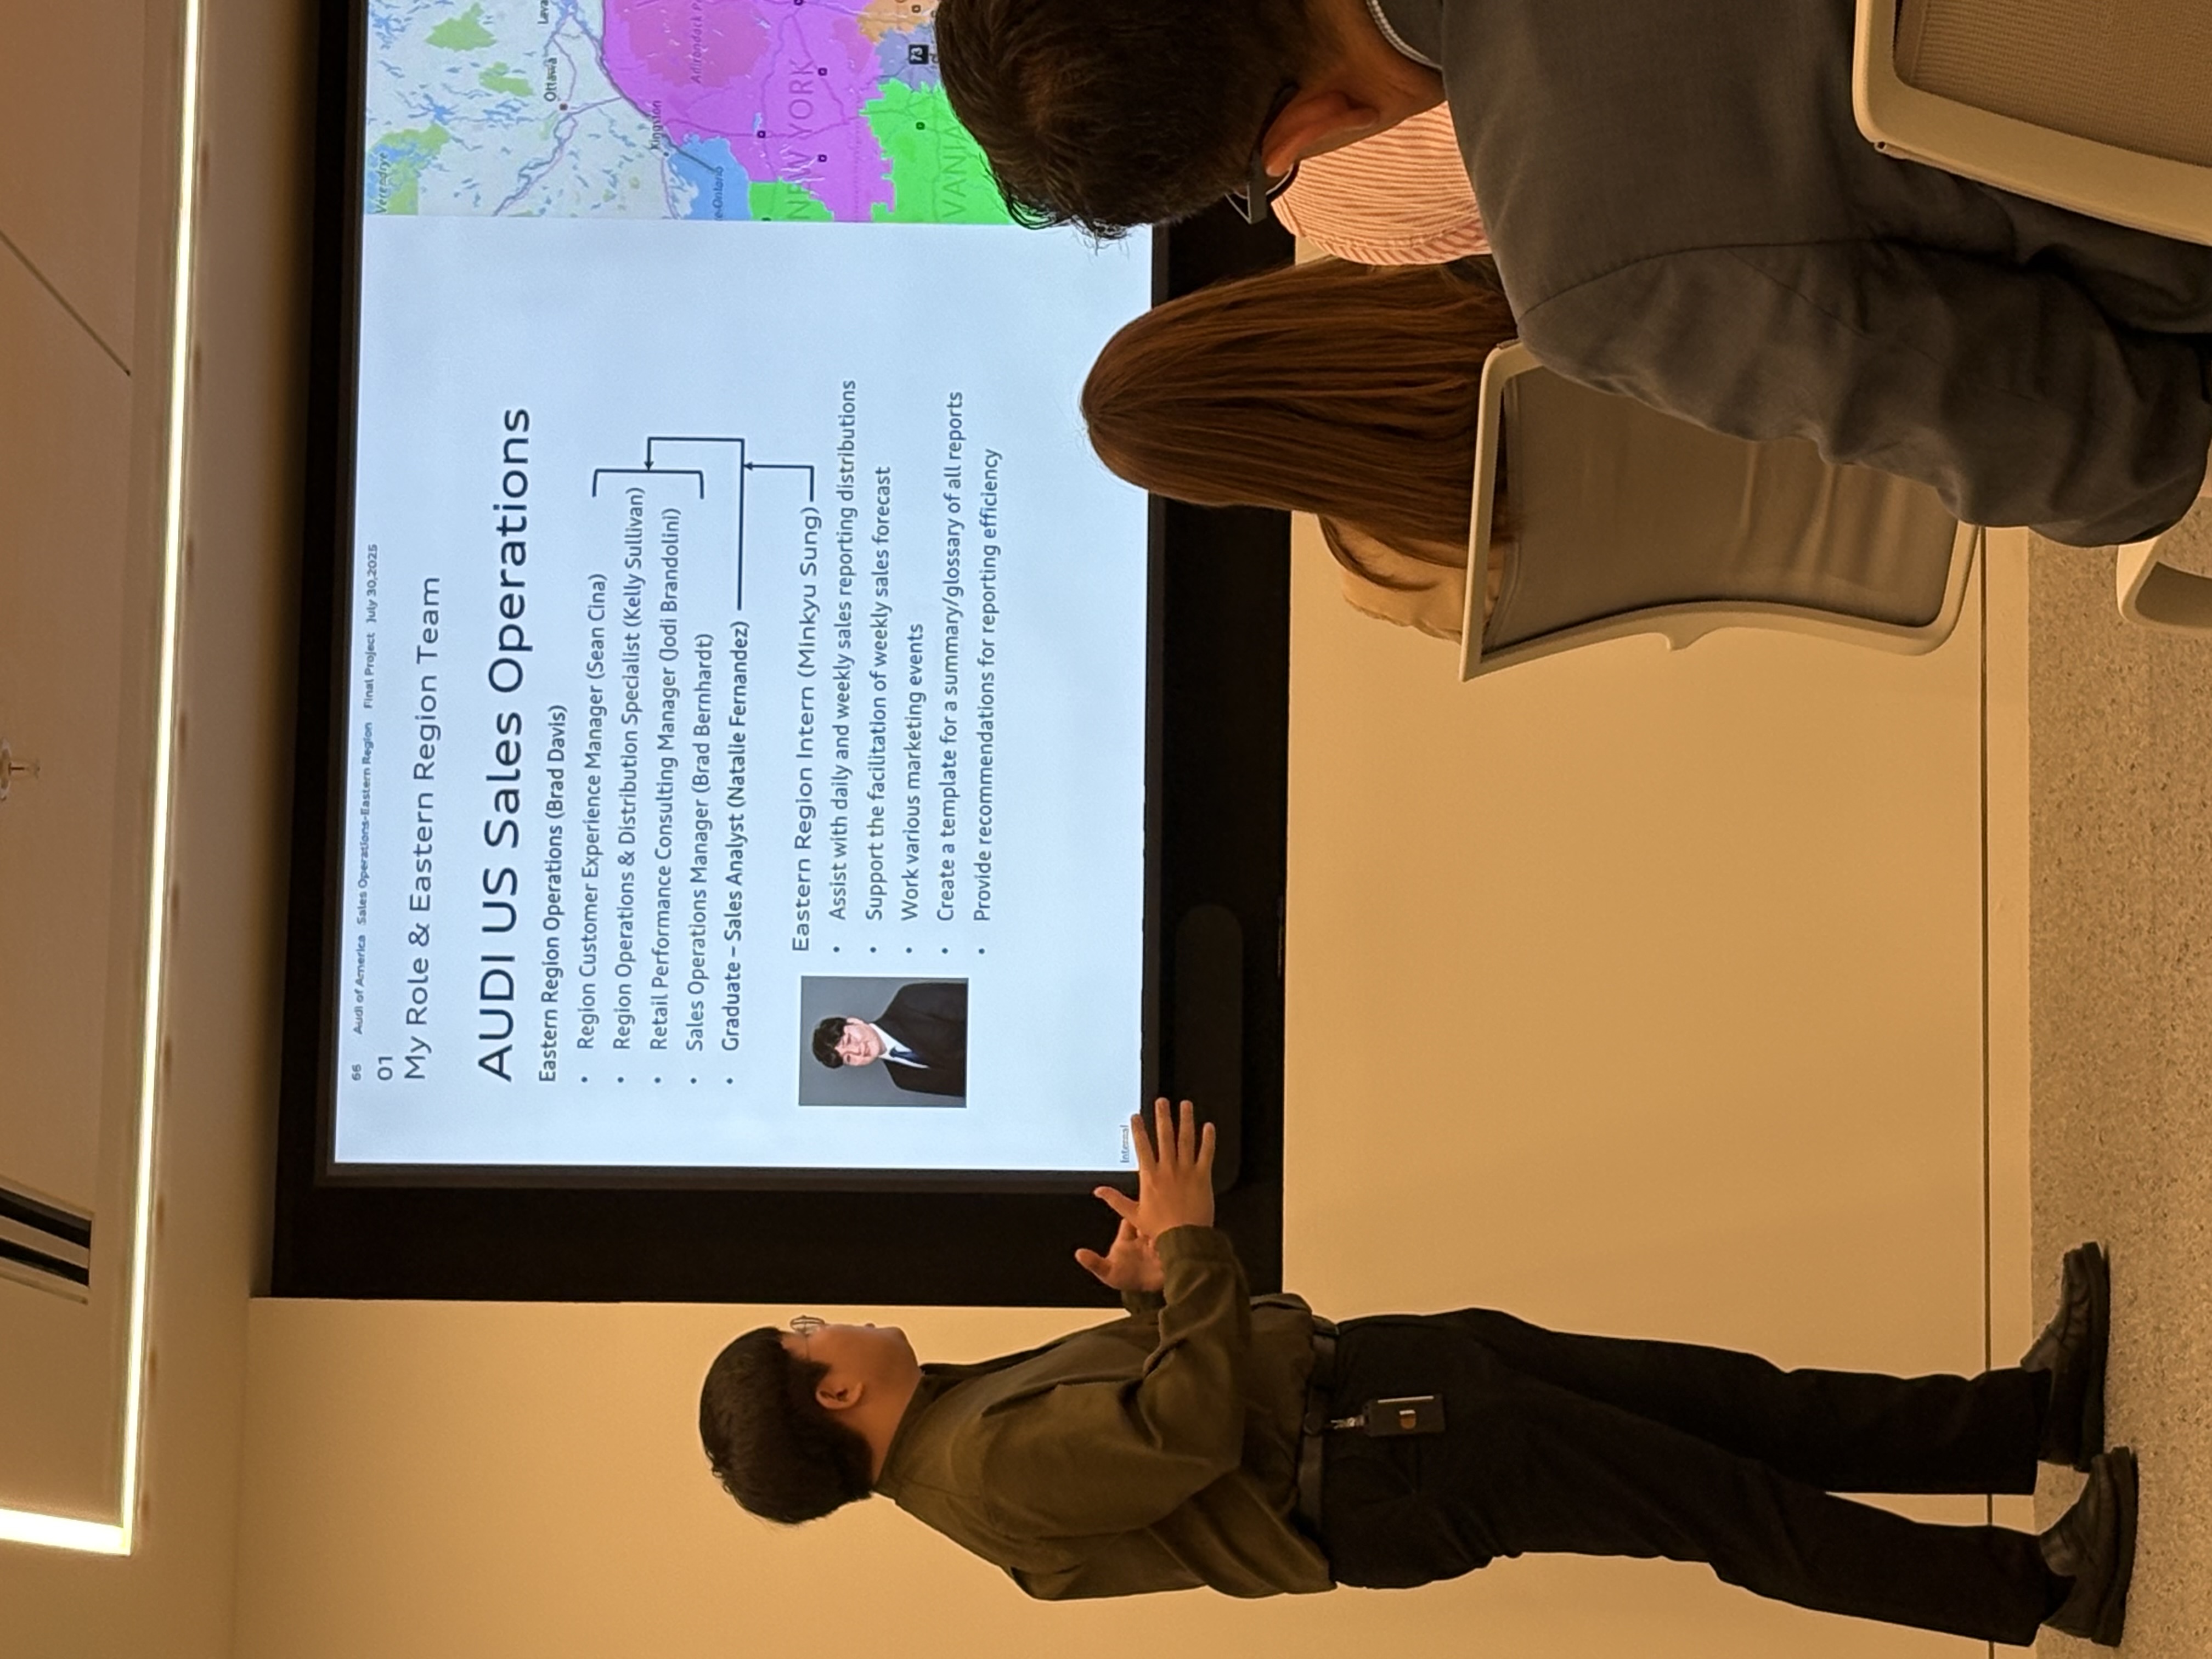
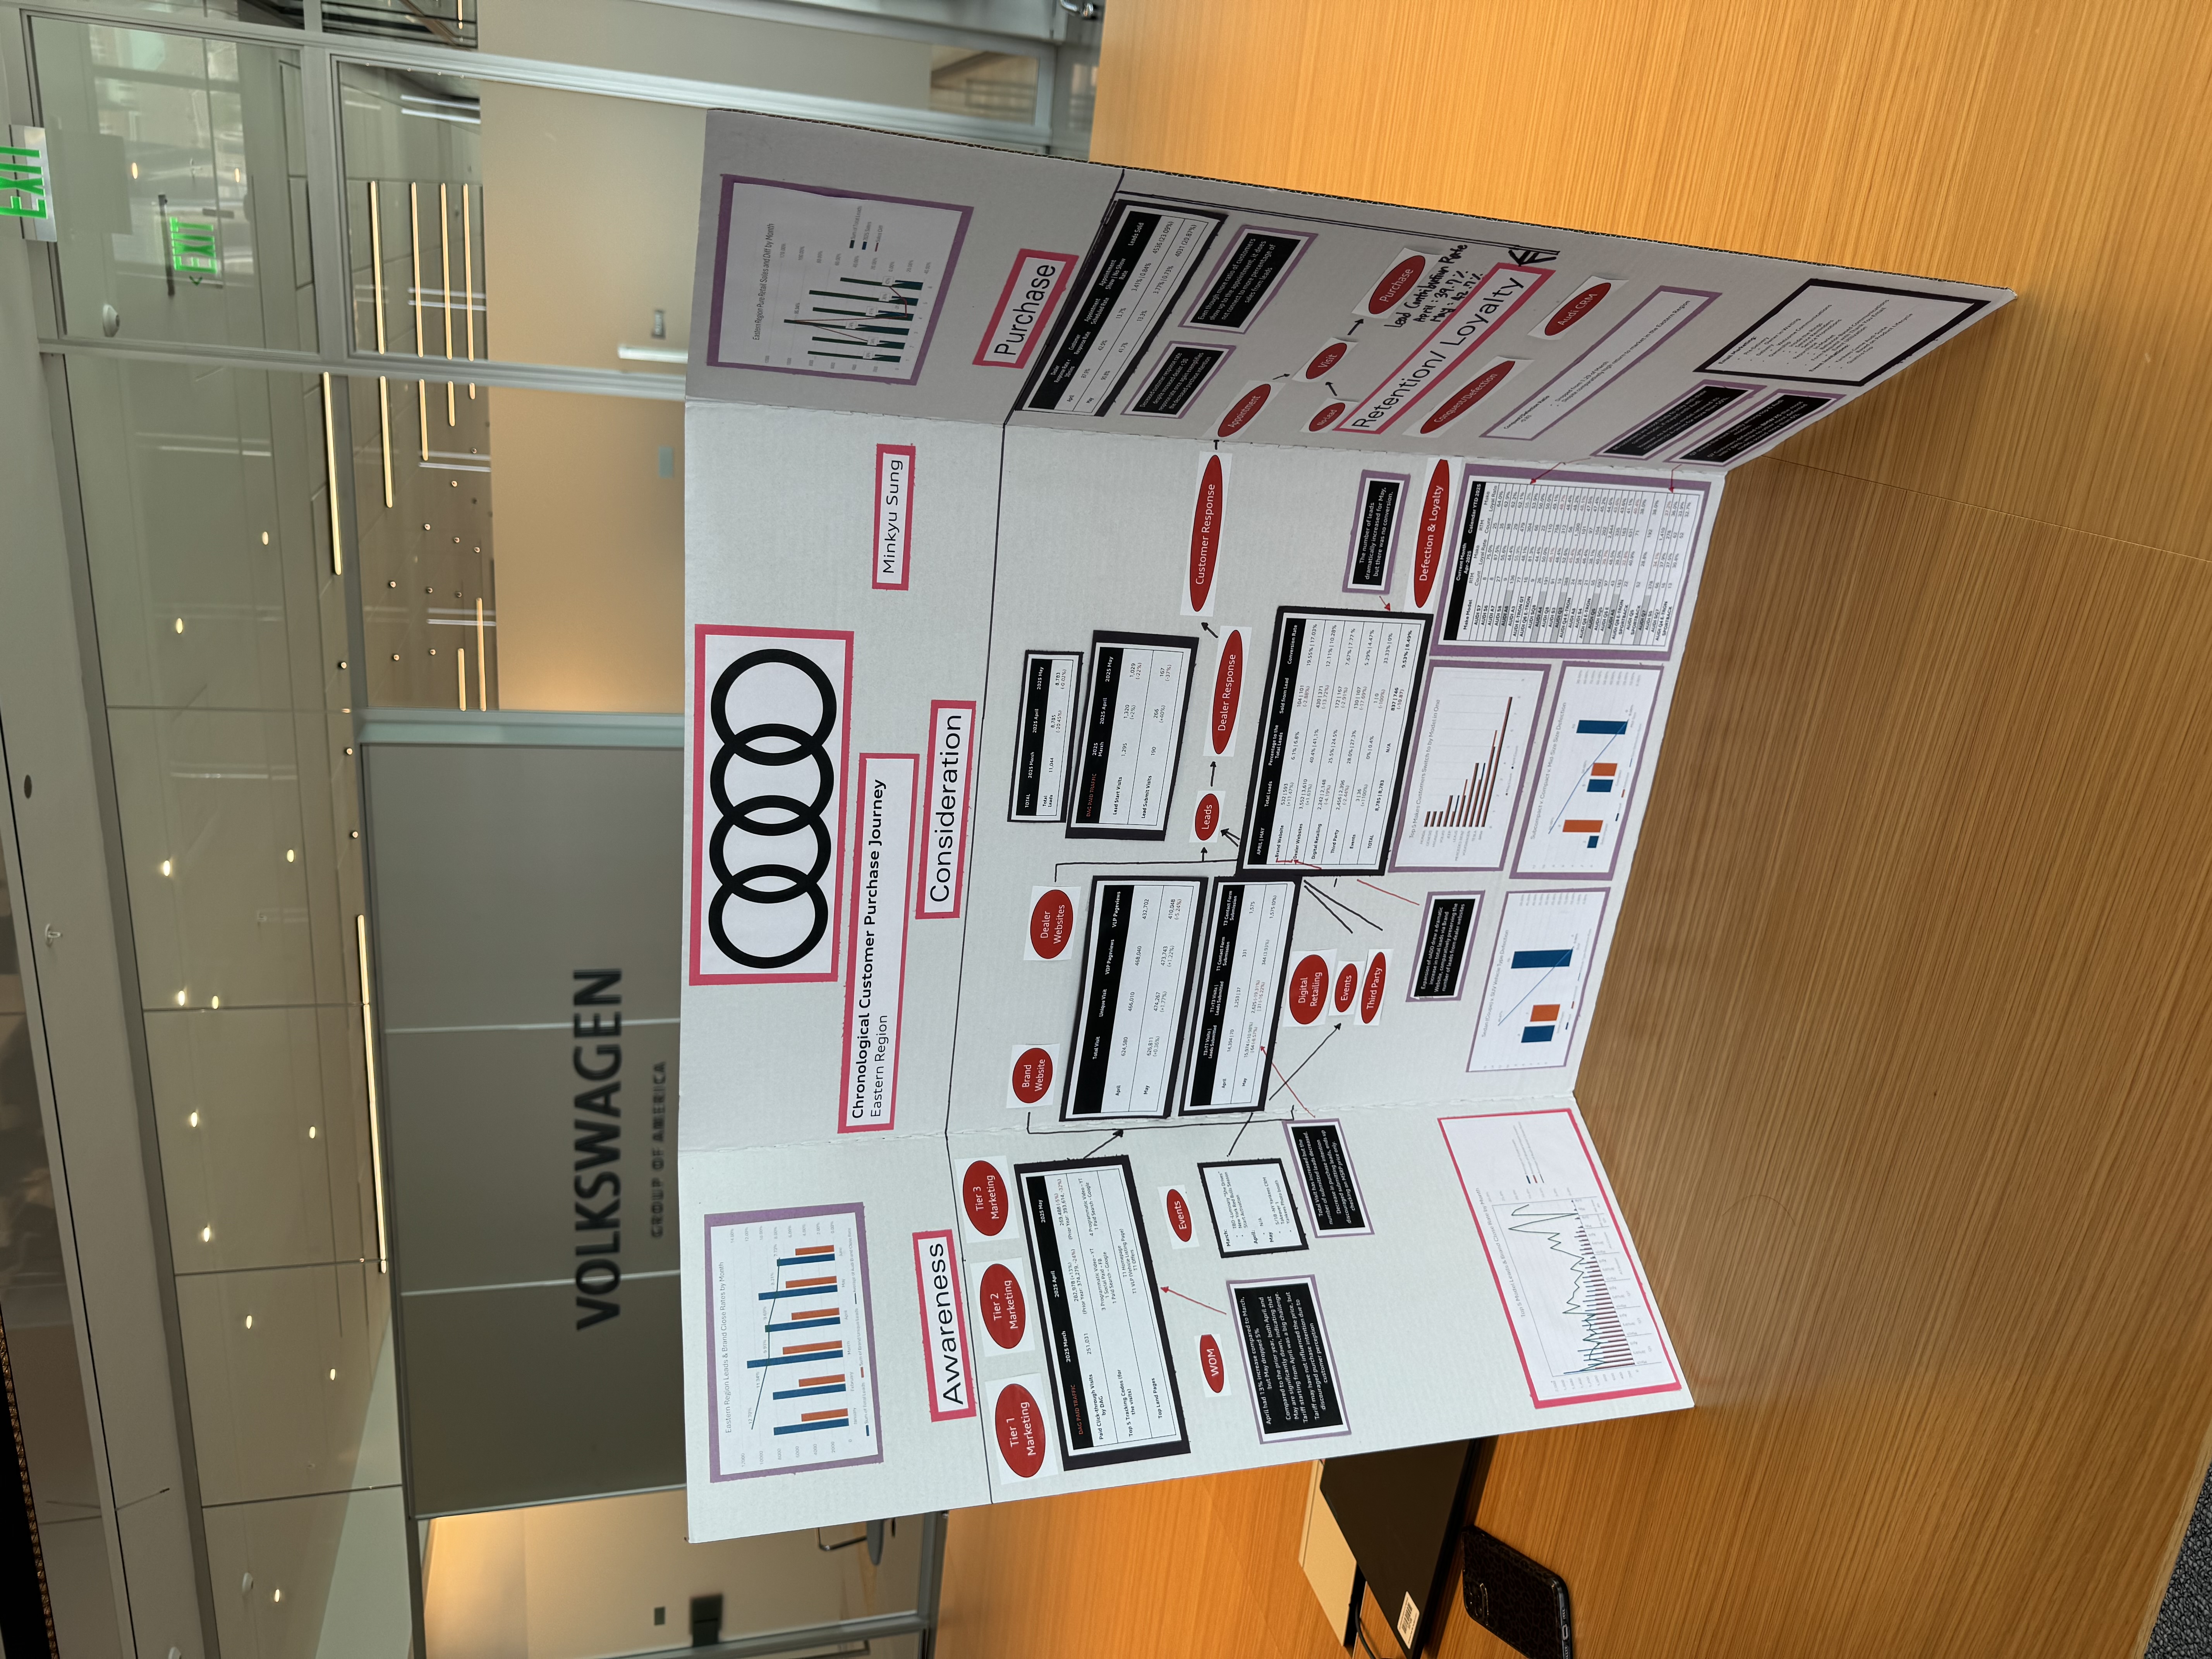
As a Regional Operations intern, I built an end-to-end funnel analysis spanning Awareness → Consideration → Purchase → Retention, synthesizing paid-media, web-analytics, lead, and CRM data across thousands of monthly leads and 5 channels, giving regional marketing leadership a single view of where the funnel leaked.
- Diagnosed a double-digit percentage decline in lead-to-sale conversion by segmenting across all lead sources, isolating Brand Website as the highest-converting channel at roughly 1.6× the dealer-site rate, the highest-ROI reallocation target.
- Reframed a suspected "traffic problem" as a purchase-intent problem: total visits rose while lead submissions fell, and a sharp year-over-year paid-traffic decline traced to the spring tariff onset.
- Exposed a dealer-response paradox: dealers kept getting faster at responding to leads while customer response and units sold fell. That redirected the team toward lead quality over velocity.
- Flagged retention risk as the conquest/defection ratio fell below parity, identifying the least- and most-loyal models in the top-6 lineup and the competitor lines defectors chose.
- Showed expanding oADD lifted Brand Website lead volume by double digits while preserving dealer-site volume, with leads contributing a growing share of total sales month-over-month.
Specific figures are generalized to respect Audi’s internal data.
Instrumenting an internal funnel.
Procurement at Samsung runs a funnel of its own: 500+ vendor onboarding requests a year across 32,000+ SAP vendor accounts, each one a journey from request to compliant, transacting vendor. As the team's Process Innovation analyst, I treated it the way a marketer treats a conversion funnel: instrument it, find the leak, fix it, then automate the reporting.
- Built the team's first KPI-tracking dashboard, turning an unmeasured pipeline into stage-by-stage cycle-time visibility.
- The dashboard surfaced a compliance-review gap nobody had measured; closing it cut vendor onboarding cycle time 40% in two months.
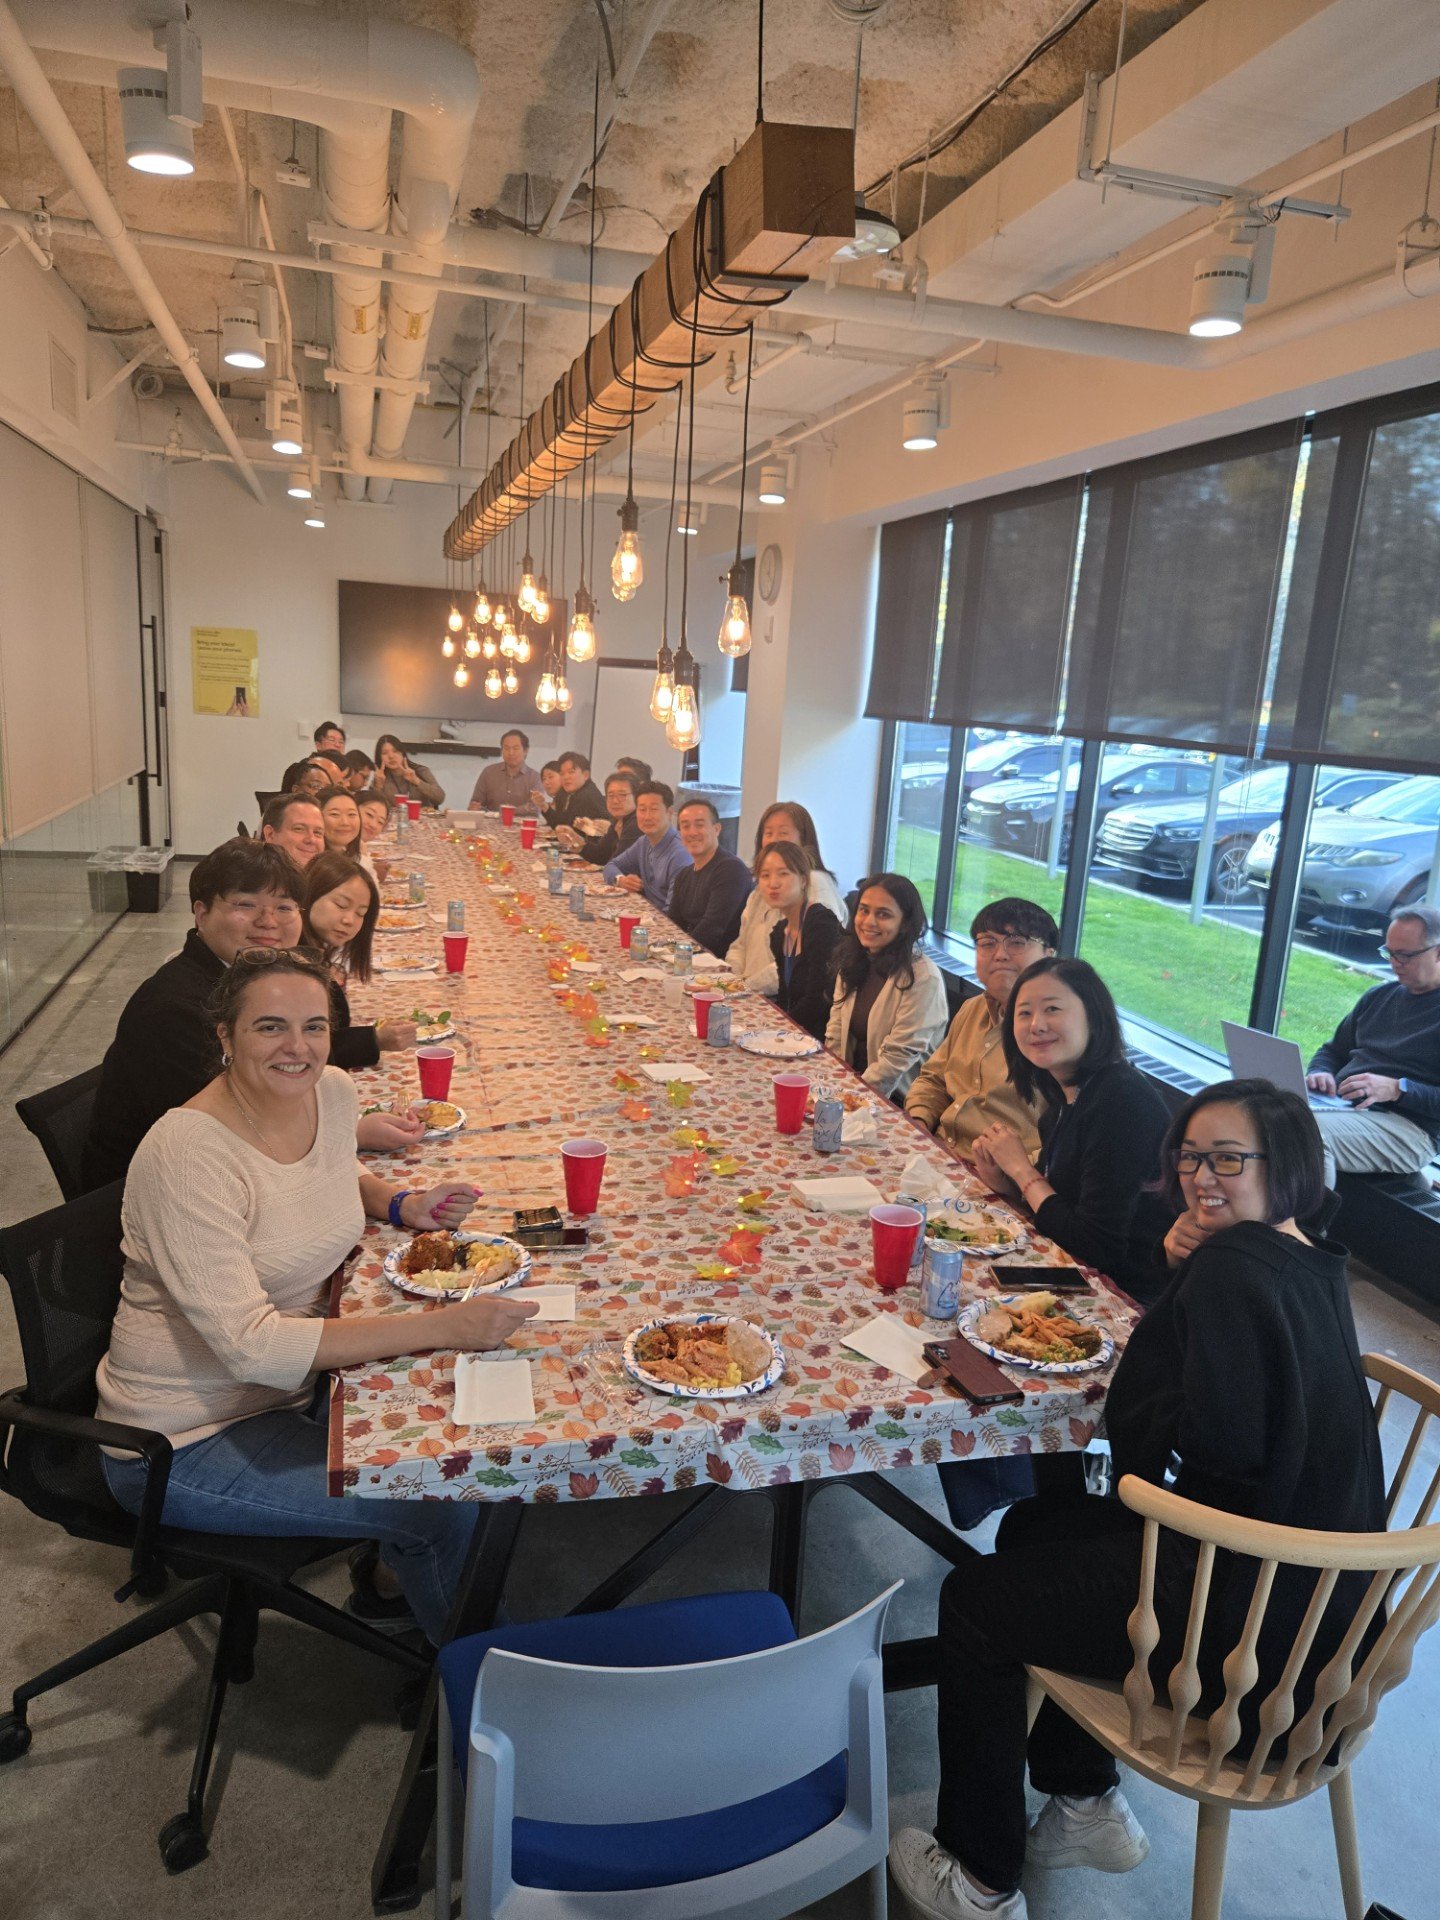
- Built a multi-agent AI tool that cut manual validation and processing time 95%, automating 75% of report generation and saving 84% of total reporting time, all inside Samsung's internal policies.
- Treated adoption as the real problem: trained non-technical staff to self-serve, protecting continuity ahead of Samsung's Texas relocation.
- Hit 100% of Management-by-Objectives in 1H 2026 while managing the vendor lifecycle in SAP end to end.
Figures reflect my own measured process improvements; no Samsung business data is disclosed.

A full digital plan for Bethesda Bagels.
Bethesda Bagels is an established DMV bagel shop (est. 1982) with strong walk-in demand but no structured digital program. I built an end-to-end plan (audit → paid search → social → B2B → measurement), treating each channel as a job to be done rather than a box to check.
Each platform was matched to a distinct buyer and intent level:
- Google Search = high-intent capture. The forecast returned an 8.2% CTR at just $0.28 CPC (~3,200 clicks/mo on $900), and 94% of those clicks were mobile, which set up the site recommendation below.
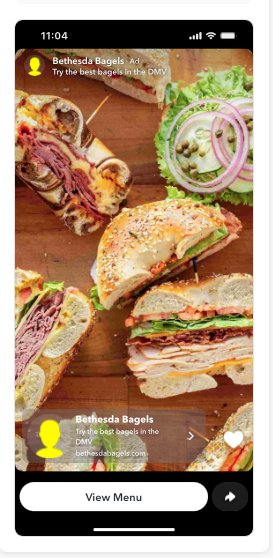
- Meta + Snapchat = neighborhood demand. Dayparted creative, split between a traffic push (8pm–5am, next-day planning) and a DMV awareness build, anchored on the shop's proximity to the Capital Crescent Trail.
- LinkedIn = the catering opportunity. A lead-gen play to DC-area professionals (business dev, HR, admin) that turns a breakfast shop into a recurring office-catering account, with a projected 30-day reach of 100k–250k.
The audit surfaced the highest-leverage fix: mobile PageSpeed of 73 vs 94 desktop and a 4.7s mobile load, on a site taking almost all its paid traffic from phones. Paired with 32 broken internal links and a clunky loyalty flow, that's revenue leaking before the bagel's in the cart.
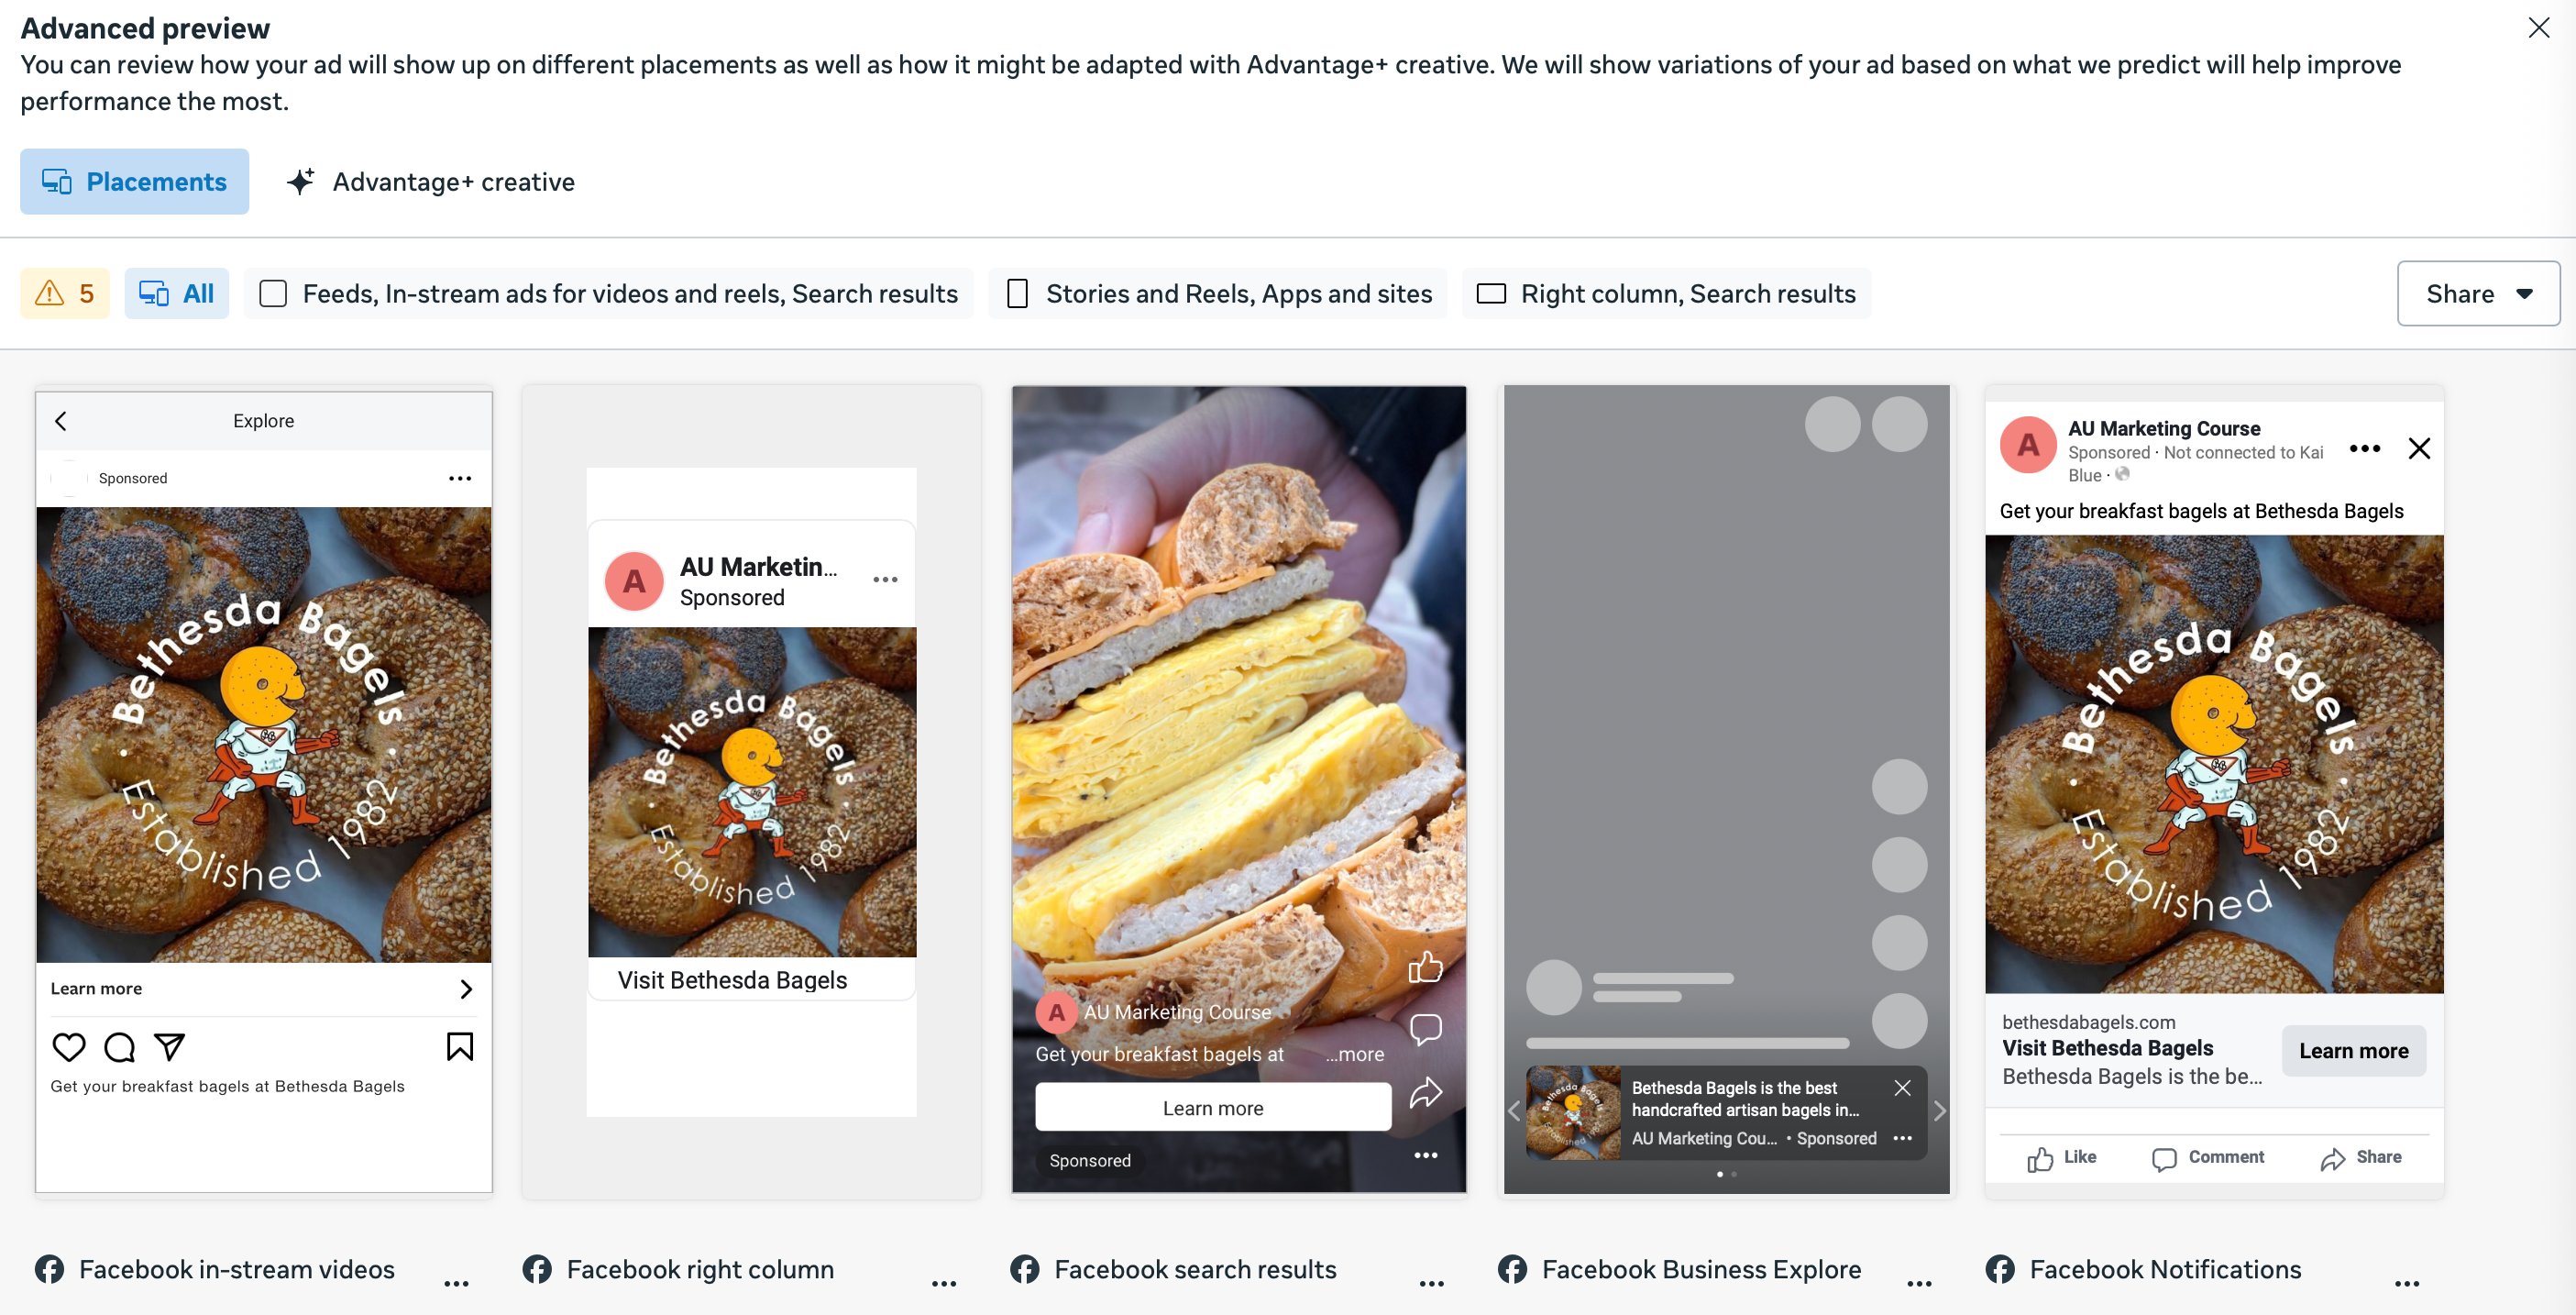
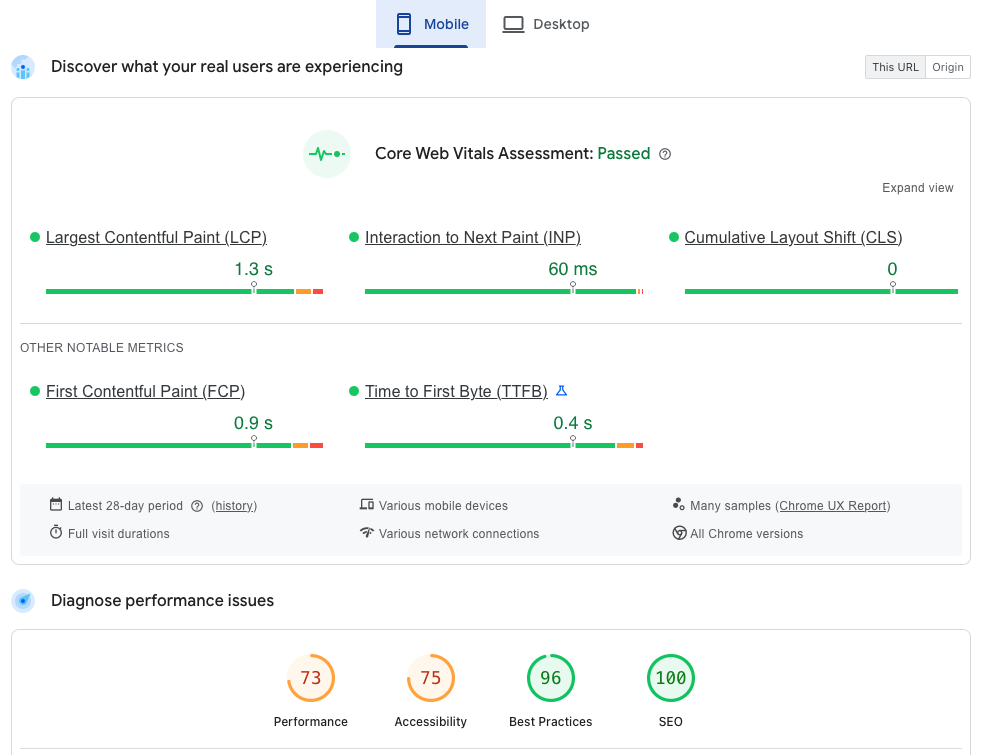
PageSpeed + Semrush: found the mobile-speed and broken-link drag.
Google Search on high-intent keywords: 8.2% CTR, $0.28 CPC.
Meta, Snapchat & LinkedIn by audience and daypart.
A/B tests + GA4 KPIs on loyalty sign-ups, followers, online orders.
AWAY luggage, winning the switchers from Rimowa.
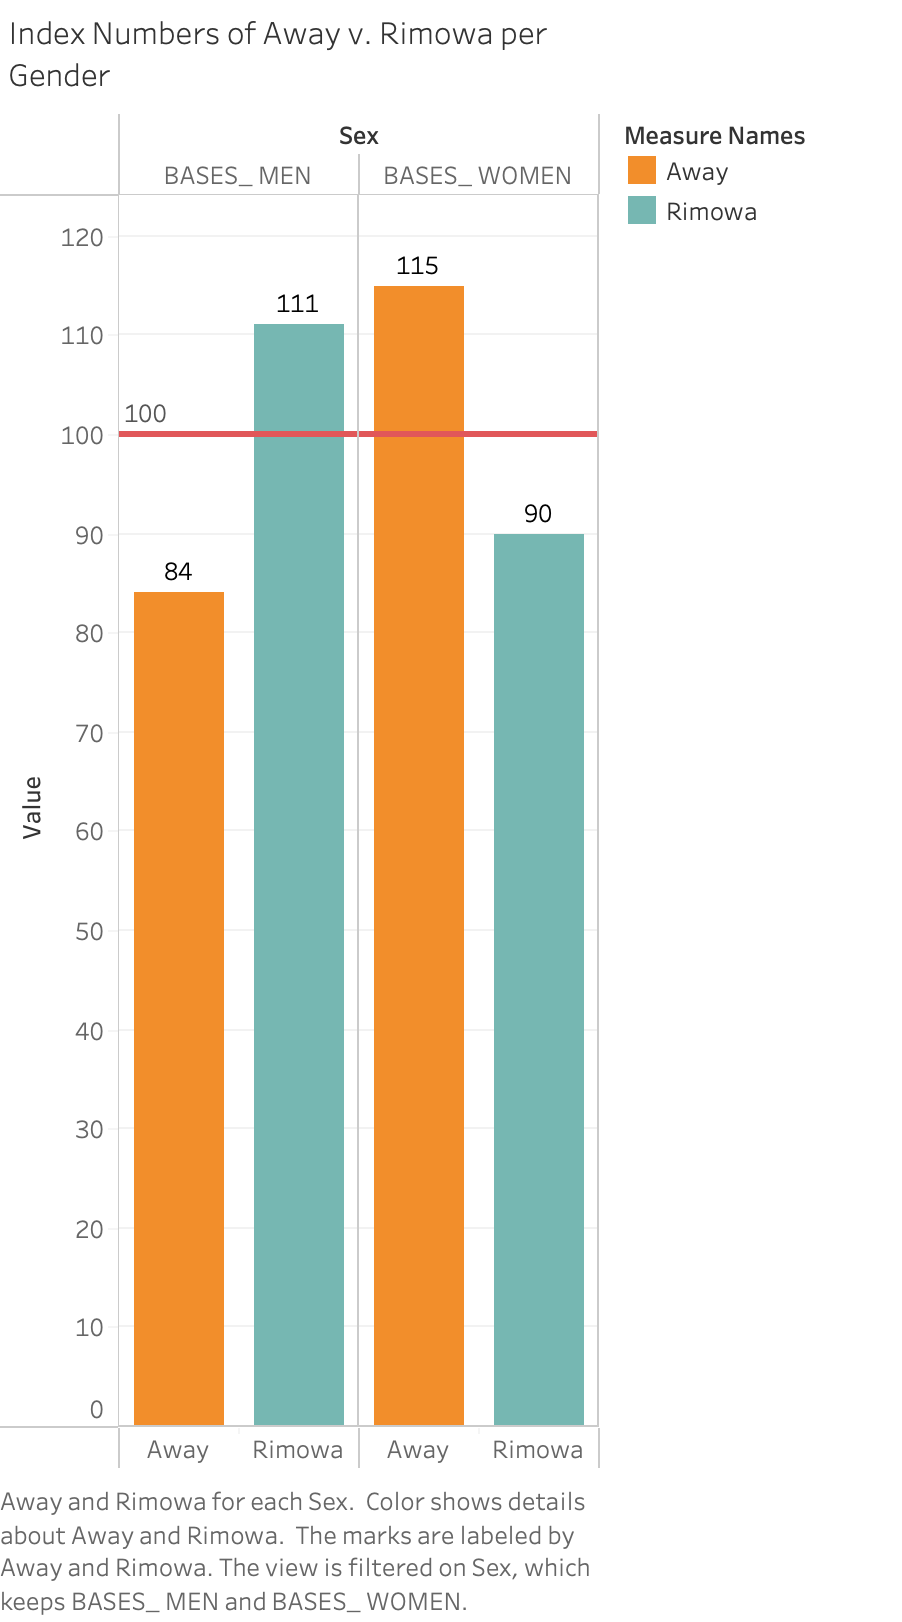
The real question was who was most winnable. Working from MRI-Simmons brand-preference data in Tableau (index 100 = category average), I found AWAY's sharpest opening: young Asian millennial men, 30–34. The read was counterintuitive. Among Asian consumers, women already favor AWAY over Rimowa (115 vs 90), but men lean the other way (84 vs 111). That gap is the strategy: hold the female base, convert the men.
Three data-driven recommendations followed:
- Cut the obvious TikTok buy. This group over-indexes on YouTube, Instagram, and LinkedIn and under-indexes on TikTok and Snapchat, so the full $1M went to those three channels, one funnel across them.
- Drop the travel-fantasy trope. This audience has typically already traveled abroad by 30, so the creative sells competence and memory, not aspiration.
- Lead with authentic representation. Roughly 60% of Asian Americans say brands don't reflect their experience, so the concepts center a Korean-American traveler and cultural cues rather than a generic model.
Every funnel stage was then judged on the metric that fit it instead of one blended number: CPM and reach at the top, CTR and CPC through the middle, and ROAS at the bottom.
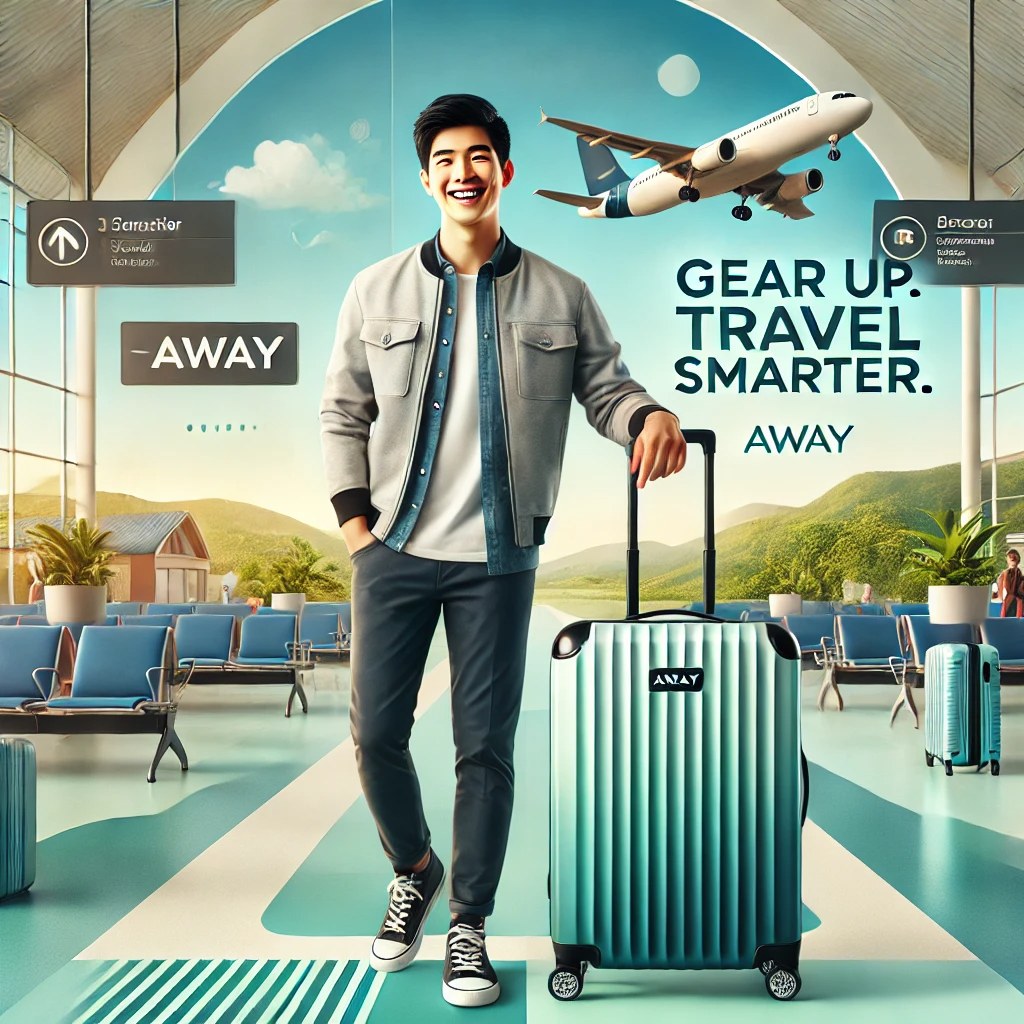
YouTube and Instagram reach, measured on CPM and reach.
Instagram and LinkedIn engagement, measured on CTR and CPC.
Retargeting to purchase, measured on ROAS.
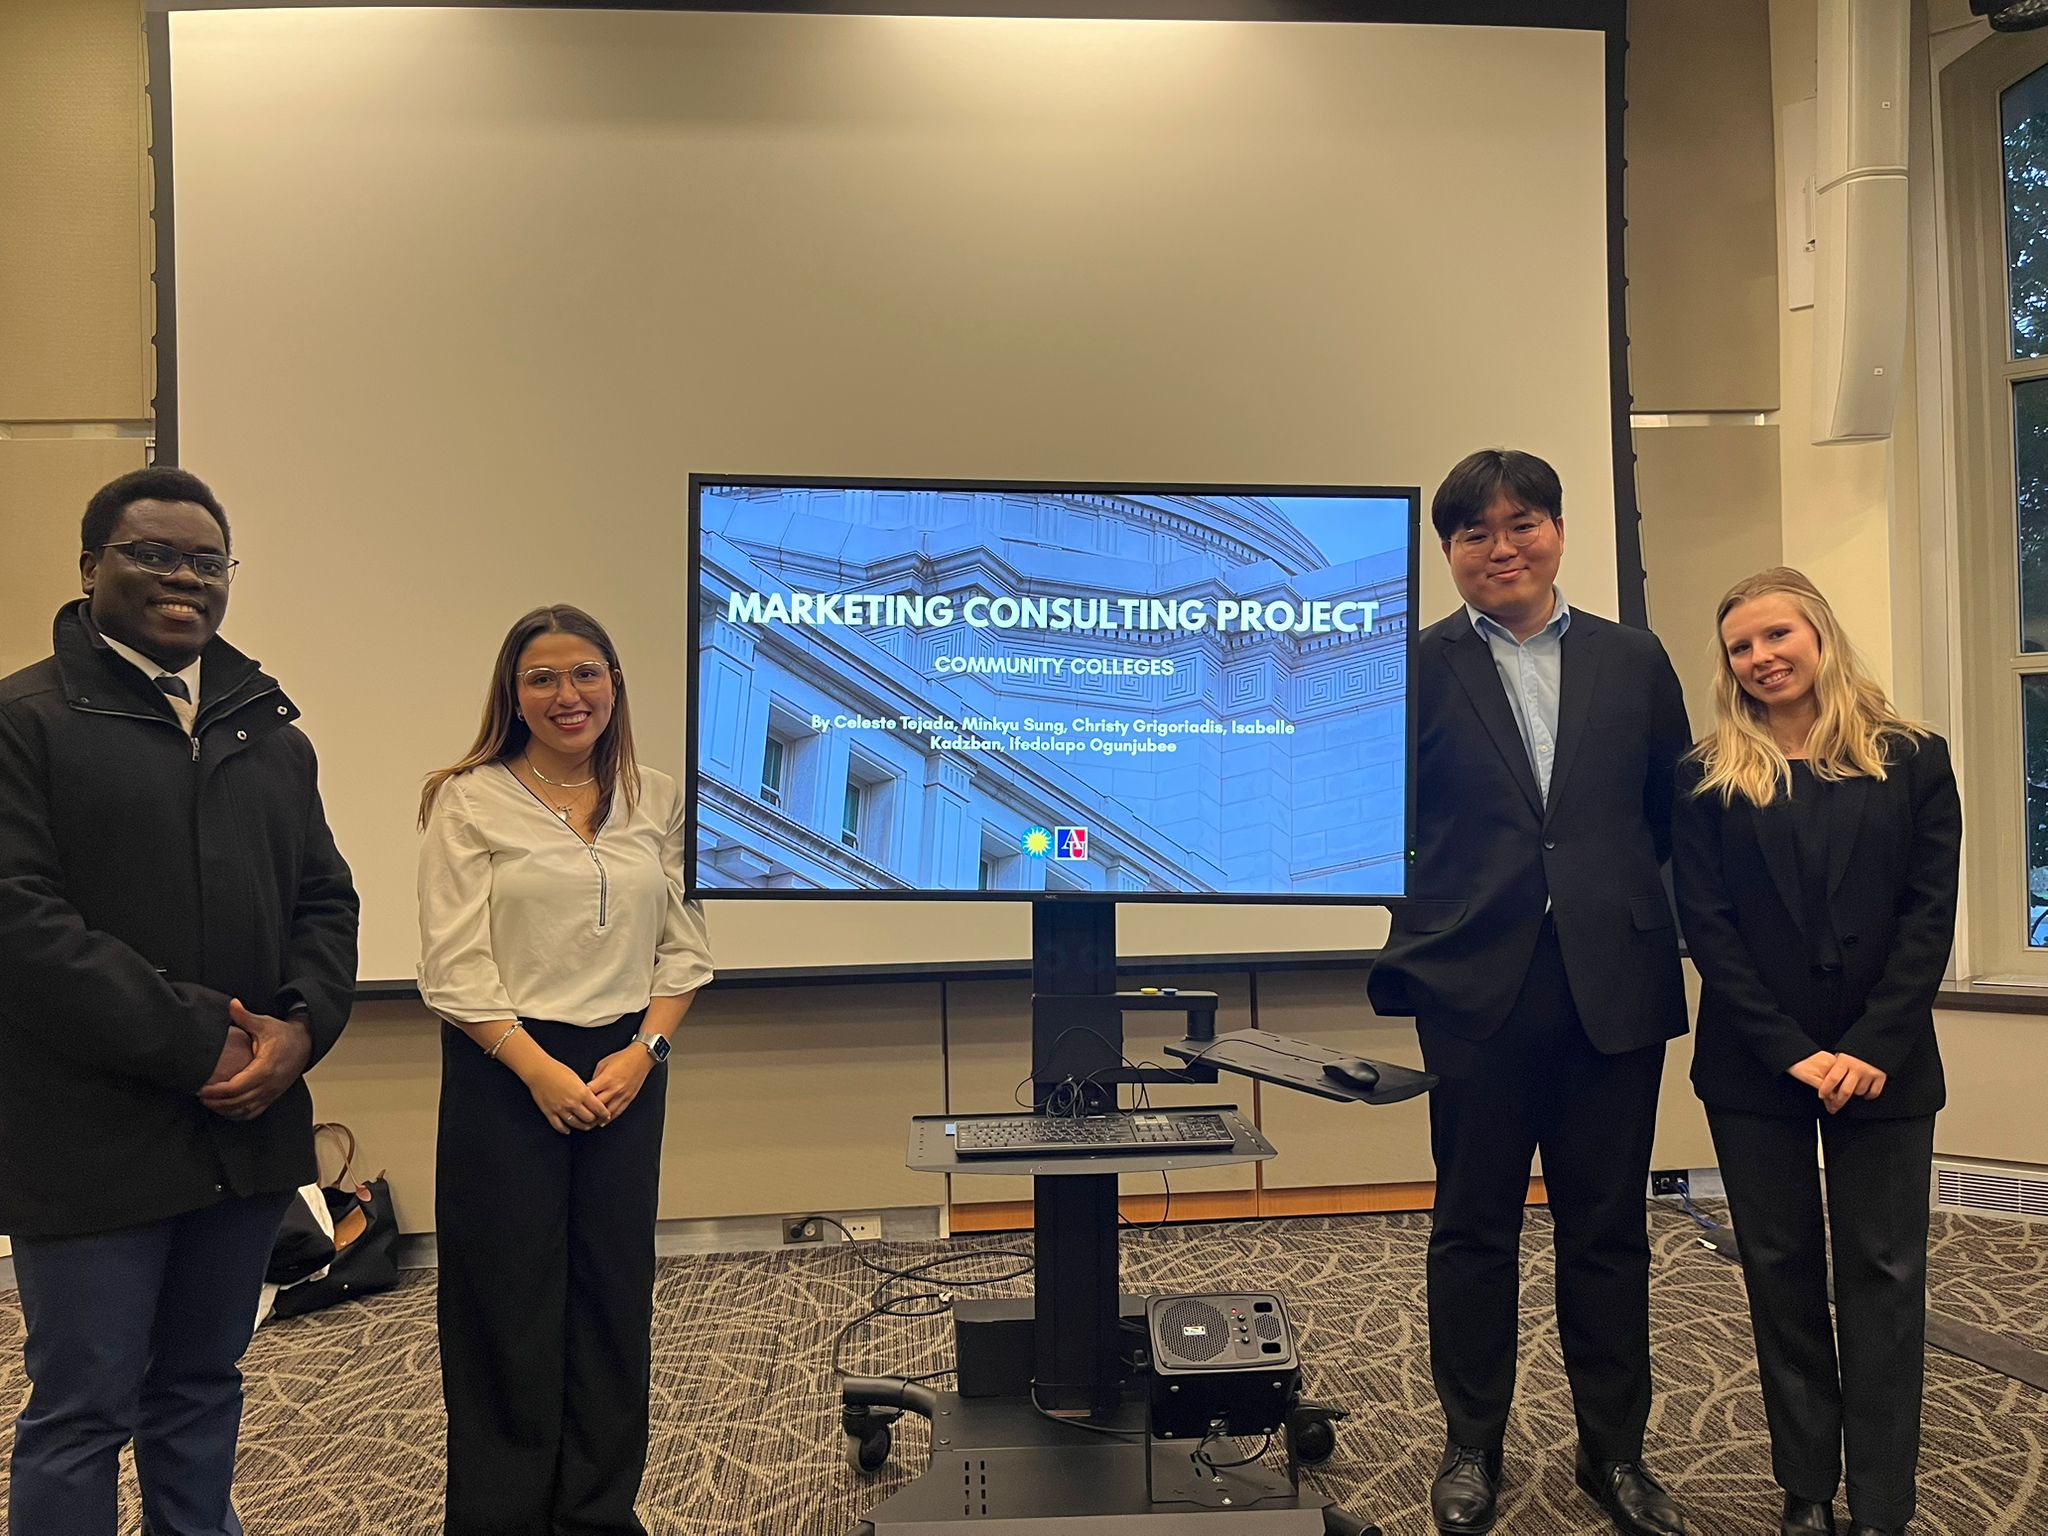
Bringing community-college students into the Smithsonian.
A semester-long consulting project for the Smithsonian National Museum of Natural History. Four teams were each assigned a slice of the 18–24 undergraduate audience: public universities, private universities, community colleges, and HBCUs / minority-serving institutions. Ours owned community colleges: the segment with the least museum-going habit and the most to gain.
I ran the environmental analysis and primary research, then analyzed it in SPSS and Tableau to move from a broad segment to a defensible target. What surfaced shaped the recommendations:
- Target by benefit sought, not demographics alone, segmenting on user type (families, students, researchers) and the specific value each came for, so outreach could speak to a reason to visit.
- Close the identity–image gap: the NMNH wants to be seen as cultural, educational, and accessible and inclusive, but community-college students didn't read it that way. The strategy leaned on that missing "accessible" pillar.
- Convert first-timers to members: a loyalty ladder from first-time visitor to frequent member, with exclusive events and tailored exhibits as the rungs.
The strategy hinged on the pillar the target audience wasn't feeling: accessible.